Build Data Apps on Databricks in Minutes Based On Fresh Web Data
From Web to Dashboard: Build Live Data Apps on Databricks in Minutes

Alon Goldenberg

.png)
Build Data Apps on Databricks in Minutes Based On Fresh Web Data
From Web to Dashboard: Build Live Data Apps on Databricks in Minutes
Alon Goldenberg
Most popular articles
Get structured, reliable data for your stack.
Much of the data that drives business decisions, like competitor prices, AI search rankings, job postings, betting odds, and real estate listings, lives on the web instead of a data warehouse. Getting it into Databricks has historically meant engineering work most teams can't justify.
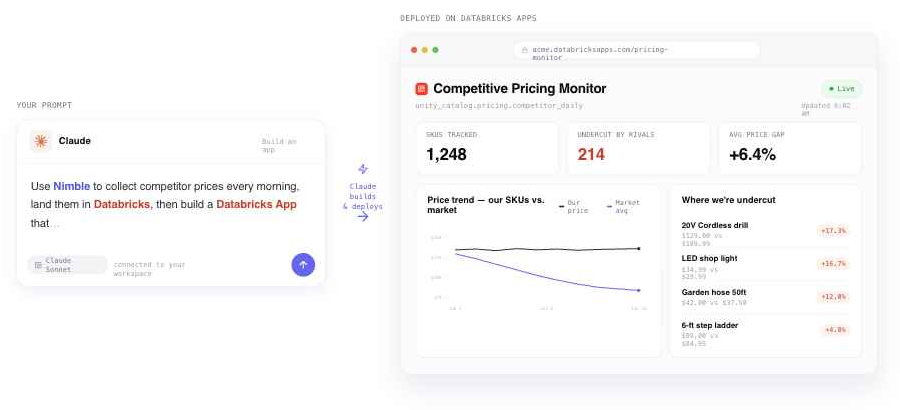
Nimble changes the math: connect it to Databricks, tell Claude what you want, and you have a live data app collecting and visualizing fresh web data in minutes.
The use cases for building apps to analyze live web data span every industry:
- Retail and CPG: track competitor pricing, digital shelf rankings, and product availability across every major retailer in real time
- Finance and investing: monitor public company signals like job postings, news sentiment, pricing changes, and market positioning
- Sports and media: fuse betting markets, AI consensus, news volume, and live results into a single intelligence dashboard
- Real estate: pull live listings, price-per-square-foot trends, and inventory data across any market or zip code on demand
- Brand and marketing: measure AI visibility (AEO) across ChatGPT, Gemini, Perplexity, and Google AI to understand how AI assistants describe your brand to buyers
- Sales and competitive intelligence: track what competitors are saying, hiring for, and charging, updated continuously
None of these require a data engineering team to stand up. The combination of Nimble's web data collection, Databricks' infrastructure, and Claude's ability to generate and deploy apps means anyone can describe what they want to get a live application running in their Databricks workspace inside an hour.
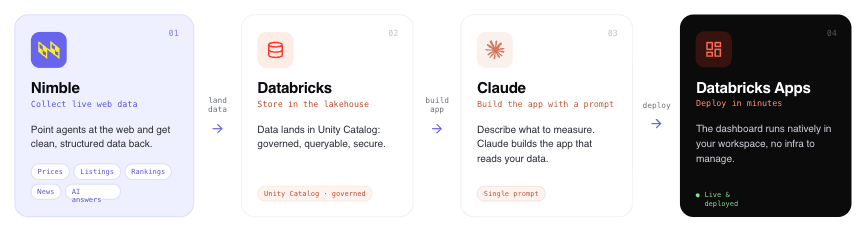
Getting Started: From Web Data to Deployed App in Four Steps
Step 1: Connect Nimble to your Databricks workspace. Install Nimble directly from the Databricks Marketplace by searching for "Nimble" and clicking Install. In the setup dialog, give the connection a name and paste in your Nimble API key. This gives you all the tools you need to bring fresh web data into your DBX tables.
Step 2: Build your data collection with Nimble. Using Claude (in the Databricks AI Playground, Databricks Assistant, or Claude.ai with the Nimble plugin), describe the web data you want to collect. Claude will use Nimble's Web Search Agents to pull live data from any target source and stream the structured results directly into Databricks storage.
Step 3: Build the app. With data landing in Databricks, tell Claude what kind of app you want on top of it. Claude generates a full application, including dashboards, charts, filtering, and analysis views, tailored to the data it just collected. API keys and credentials are stored securely in a Databricks secret scope and injected at runtime, so nothing sensitive ever touches the code.
Step 4: Deploy on Databricks. Claude packages and deploys the app as a native Databricks App using a Databricks Asset Bundle. One command, one URL, gated by your existing workspace authentication. No separate frontend host, no infrastructure to manage, no extra configuration.
What You Can Build: Three Real Examples
1. AEO Insights: Are AI Assistants Sending Buyers to You — or Your Competitors?
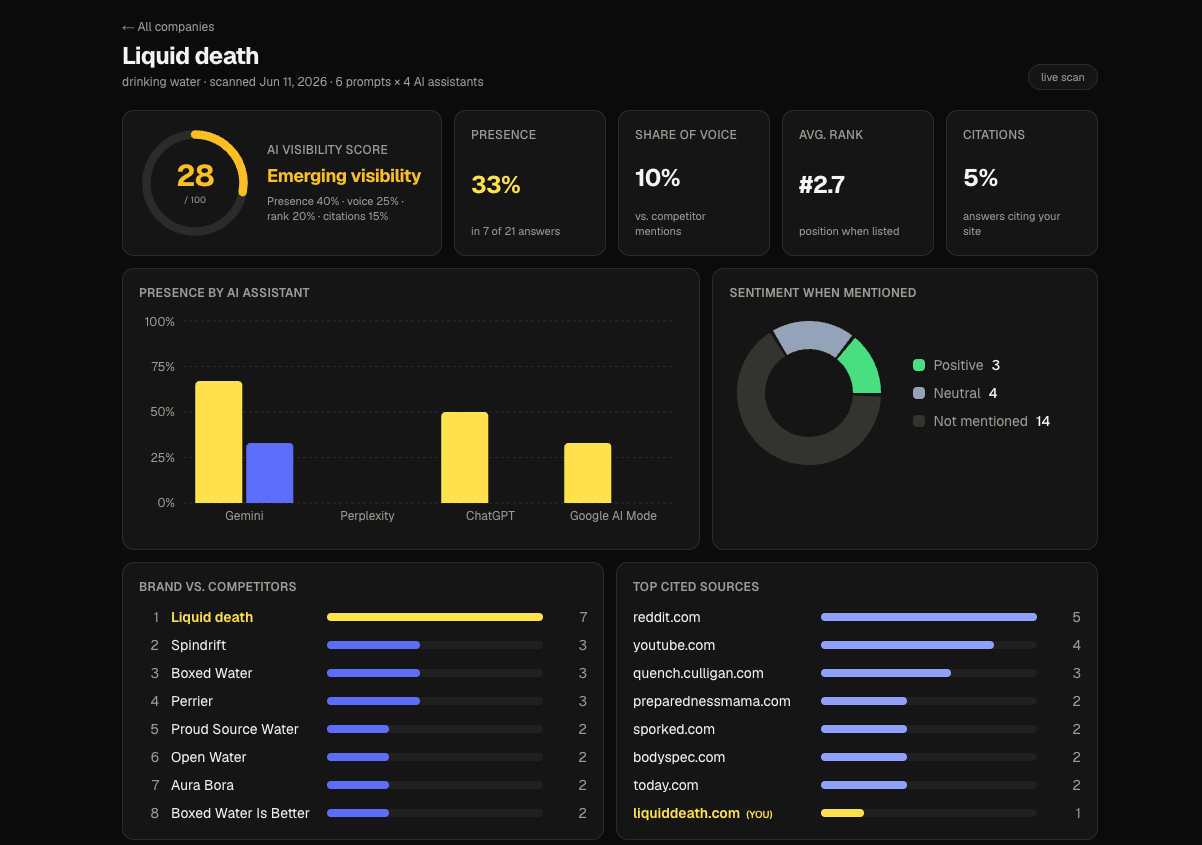
Answer Engine Optimization (AEO) is the emerging practice of making sure AI assistants mention your brand when buyers ask questions. The problem: there's been no easy way to measure it at scale. The Nimble AEO Insights app solves that.
Enter any company name, and the app reports whether ChatGPT, Gemini, Perplexity, and Google AI mention that brand in response to real buyer-intent questions, along with where it ranks, the sentiment, and which sources get cited. It's the AI equivalent of a search rank tracker.
Here’s how the data goes from the web into the custom app:
- Claude generates realistic buyer-intent questions for the company's industry, such as "best CRM for mid-market sales teams" or "alternatives to [product]", without ever naming the brand, so the measurement reflects organic visibility.
- Nimble's Web Search Agents fire those questions in parallel at ChatGPT, Gemini, Perplexity, and Google AI, capturing the live AI-generated responses.
- Claude reads each response back and extracts structured metrics: brand mention (yes/no), rank position, sentiment score, competitors named, and citation sources.
- Those structured results are stored as JSON in Databricks and visualized in a Next.js dashboard running natively as a Databricks App.
As buyers increasingly start their research with AI assistants rather than search engines, AEO visibility is becoming as important as SEO. This app gives any marketing or brand team a live read on where they stand, built entirely on Nimble's ability to query AI systems at scale and Claude's ability to parse unstructured AI responses into actionable data.
The app runs as a native Databricks App with credentials stored securely in a Databricks secret scope, deployed via a single Databricks Asset Bundle command. No separate frontend hosting, no credential exposure, no infrastructure to manage.
2. World Cup Pulse: Hype vs. Reality Across Every National Team
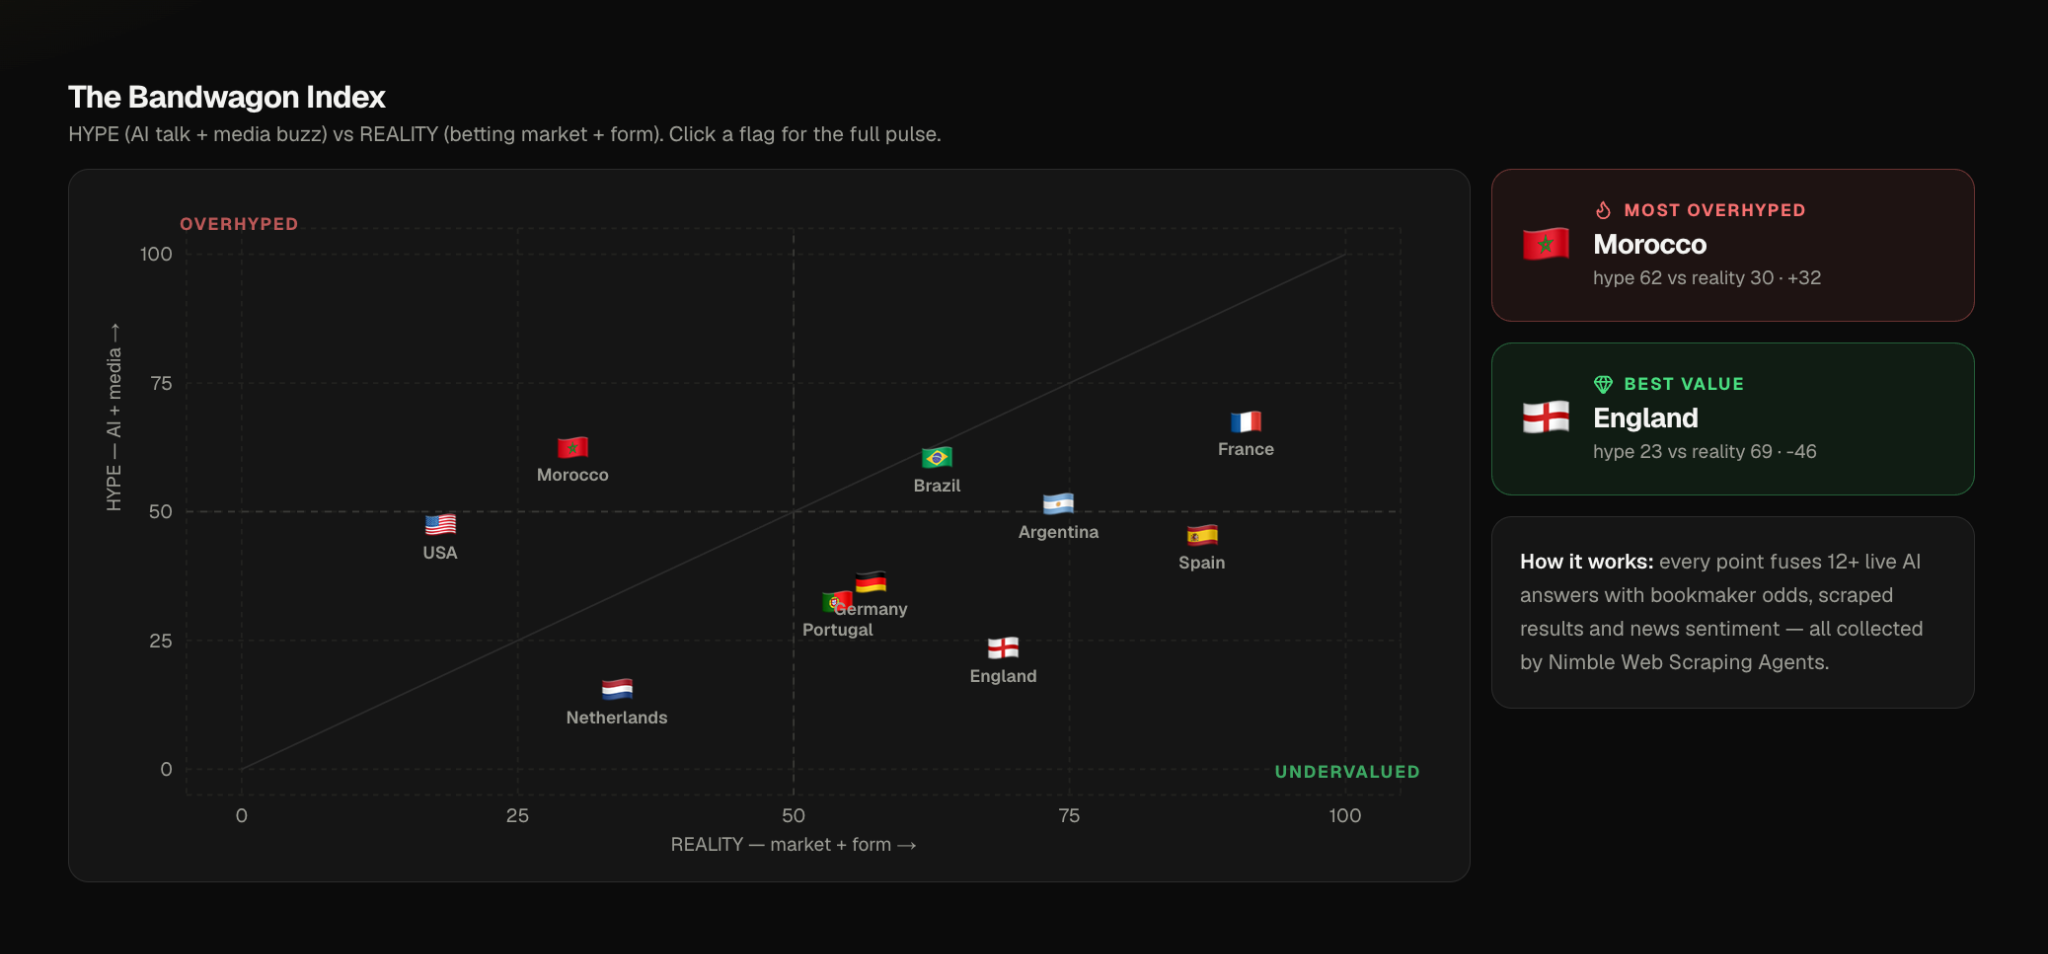
The 2026 World Cup generates a massive, constantly updating stream of public signals: odds movements, AI consensus, news sentiment, and match results. The World Cup Pulse app fuses all four into a single dashboard that answers one question: for each national team, how much of their reputation is earned versus manufactured?
What the app does. For every national team, the app surfaces four signals side by side: what AI assistants say about them, what the betting markets imply about their probability of winning, how they've actually performed in recent matches, and how much media attention they're attracting (and whether it's positive). The Bandwagon Index quadrant view plots hype against reality, surfacing which teams are overrated and which are undervalued.
Here’s how the data flows:
- 1. Nimble LLM agents pose real fan questions, such as "Who will win Group C?" and "Which team has the best midfield?", to ChatGPT, Gemini, Perplexity, and Google AI in parallel. Claude analyzes each answer for which teams are mentioned, how they rank, and the sentiment behind the characterization.
- A Nimble Oddschecker agent pulls current betting outrights and Marathonbet match odds, which are converted to implied win probabilities with the bookmaker margin stripped out.
- A Nimble Flashscore agent retrieves recent match results and computes a weighted form score across each team's last five games.
- A Nimble Bing News agent pulls headline volume by team and runs it through Claude for sentiment scoring.
- All four signals are stored as seeded JSON in Databricks and rendered by a Next.js app deployed natively as a Databricks App.
This pattern applies to any use case that requires fusing multiple live web signals, such as AI responses, betting markets, news, and sports data, into a single operational view. Nimble reaches across those surfaces in parallel, Databricks provides the storage and hosting, and Claude converts unstructured web content into structured metrics.
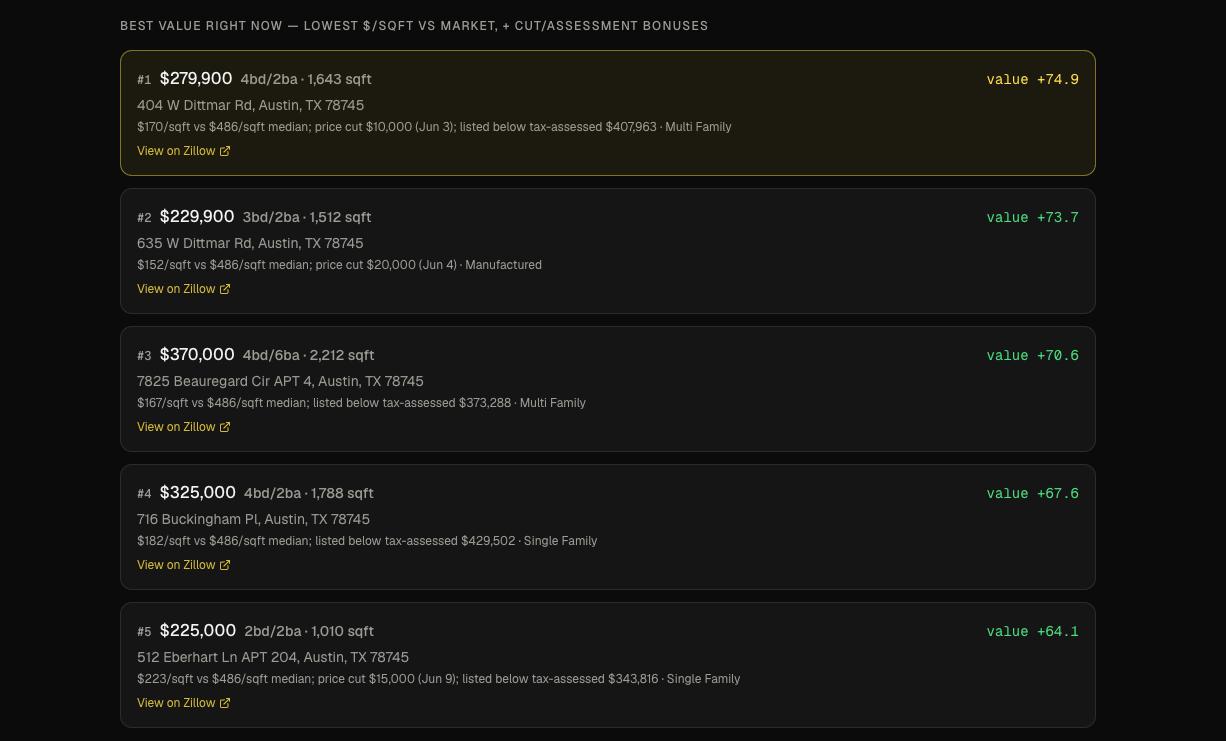
3. Rent Pulse: Live Real Estate Intelligence for Any Market
Real estate decisions — whether you're relocating, investing, or benchmarking a market — depend on data that changes daily. Zillow and similar platforms have it, but getting it into an analytical tool has historically required scraping infrastructure and ongoing maintenance. Rent Pulse makes it a single prompt.
Enter any city, and Rent Pulse queries three representative zip codes in that market in parallel. It returns the current price distribution, median price by bedroom count, and median price per square foot for buying, renting, and recently sold listings, plus the best-value homes available right now, ranked by price per square foot.
Here’s how the data flows:
1. Nimble's Zillow Web Search Agents fan out across three representative zip codes in the target city simultaneously, pulling live listing data from the active buying market, rental market, and recently sold properties.
2. That raw listing data lands in Databricks, where it's aggregated by the app into price spreads, median values by bedroom count, and per-square-foot metrics.
3. A Next.js dashboard deployed as a Databricks App surfaces the collapsed market view — median prices, distributions, and best-value properties — with no manual data preparation required.
This example demonstrates the simplicity of the pattern at its most direct. The entire application — Nimble pulling live Zillow data, Databricks storing and serving it, a deployed app visualizing it — was built with a single prompt using Claude's Nimble plugin. It took minutes, not weeks. For any use case that needs live marketplace data (real estate, job boards, e-commerce pricing, travel inventory), the pattern is identical.
Visualize the web in minutes
The barrier to building data apps on live web data has always been the pipeline. That barrier is now gone. Nimble collects the web data. Databricks stores and serves it with enterprise governance. Claude builds and deploys the app. If you can describe what you want to measure, you can ship it in an afternoon.
FAQ
Answers to frequently asked questions
.png)

.png)
.avif)
.png)