Retail Data Analytics: The Complete 2026 Guide to Benefits, Tools & Implementation
retail-data-analytics

Tom Shaked
%20(2).png)
Retail Data Analytics: The Complete 2026 Guide to Benefits, Tools & Implementation
retail-data-analytics
Tom Shaked
Most popular articles

Get structured, reliable data for your stack.
Retail Data Analytics: The Complete 2026 Guide to Benefits, Tools & Implementation
Retailers have access to substantial data. But in practice, timing issues often mean that they get less value than they should from it. Why is that? Customer behavior is constantly shifting across online stores, marketplaces, apps, and physical locations. The data is changing faster than reports get updated or reconciled, leaving e-commerce teams stuck in a reactive state and working from outdated or misaligned numbers.
This is where retail data analytics changes the game. Instead of stitching together lagging reports, analytics brings operational and customer signals into one coherent view as activity unfolds. Teams can spot shifts in demand earlier, which lets them quickly understand what’s driving changes in performance and make adjustments before issues compound.
Retail data analytics now lives or dies on real-time, omnichannel visibility. Being able to optimize based on real-time data is driving growth in the retail data analytics market, which is expected to rise from $7.73 billion in 2025 to $11.97 billion by 2030. Competitive advantage, in reality, comes down to how quickly insight turns into action. Here’s your guide to the benefits, tools, and practical steps required to take full advantage of retail data analytics in 2026.
What are retail data analytics?
Retail data analytics is how retailers turn day-to-day activity into better decisions. It’s the practice of using retail data to guide choices that directly affect revenue, margin, inventory levels, and customer retention. The key is doing analysis in such a way that it drives better decisions right now.
In practice, retail analytics sits at the intersection of multiple teams:
- Merchandising looks at it to understand what’s selling and what isn’t.
- E-commerce teams use it to monitor the digital shelf for conversion or availability issues.
- Marketing tracks how campaigns influence demand
- Operations teams rely on shared signals to keep execution aligned across channels.
When retail data analytics works, teams make decisions from the same current understanding of performance.
4 Types of Retail Data Analytics
Retail analytics falls into a few practical categories, with each supporting a different kind of decision:
- Performance Monitoring shows what’s happening across your pricing, promotions, inventory, and customer behavior as it unfolds. It gives your teams a shared pulse on the business.
- Diagnostic Analysis helps explain why results shift, whether it’s a pricing move, a stockout, a competitor change, or a channel-specific issue.
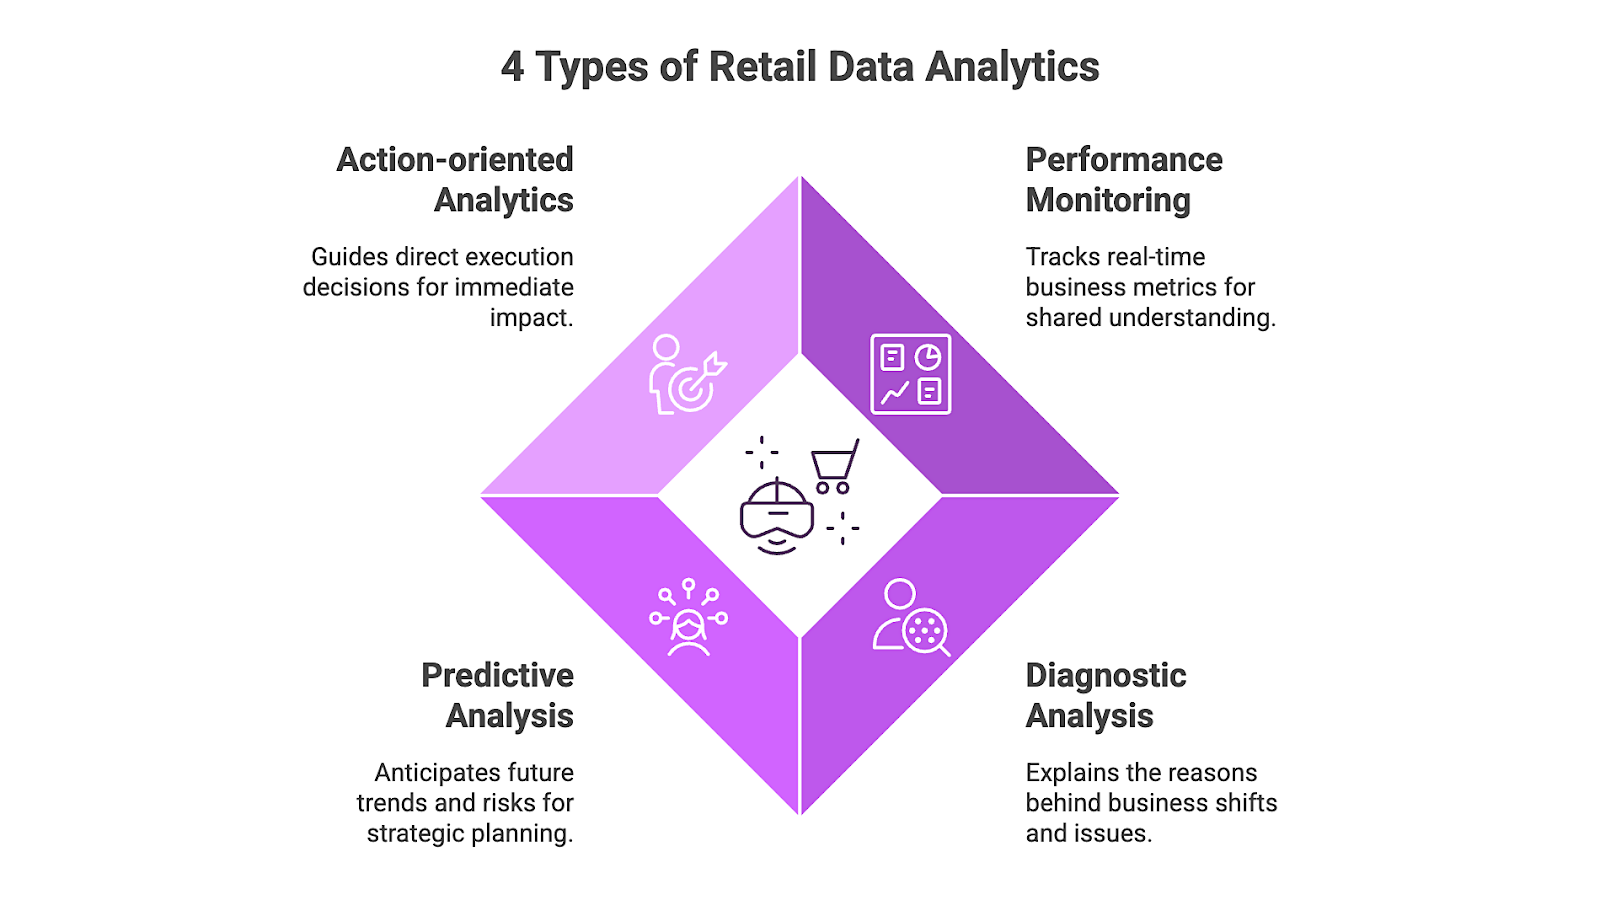
- Predictive Analysis looks ahead to help your teams anticipate demand changes, churn risk, or the impact of pricing and promotional decisions.
- Action-oriented Analytics uses insights to directly support execution decisions, such as when to reorder, where to discount, or which products need immediate attention.
What are the core data sources of retail data analytics?
Retail data analytics depends on drawing signals from multiple data sources, each capturing a different part of how a retail business actually performs. These sources do not tell the same story, but together they explain customer behavior and performance across channels.
Sales and Order Data
Sales and order data are usually the starting point. Volumes, pricing, and order timing give a rough sense of demand. On their own, they don’t explain much about why performance changed or whether it’s sustainable.
Inventory and Fulfillment Data
Inventory and fulfillment data add another layer, and this is where many issues start to show up. A dip in sales might look like weakening demand, but in reality, it can just as easily be caused by stockouts or delayed replenishment.
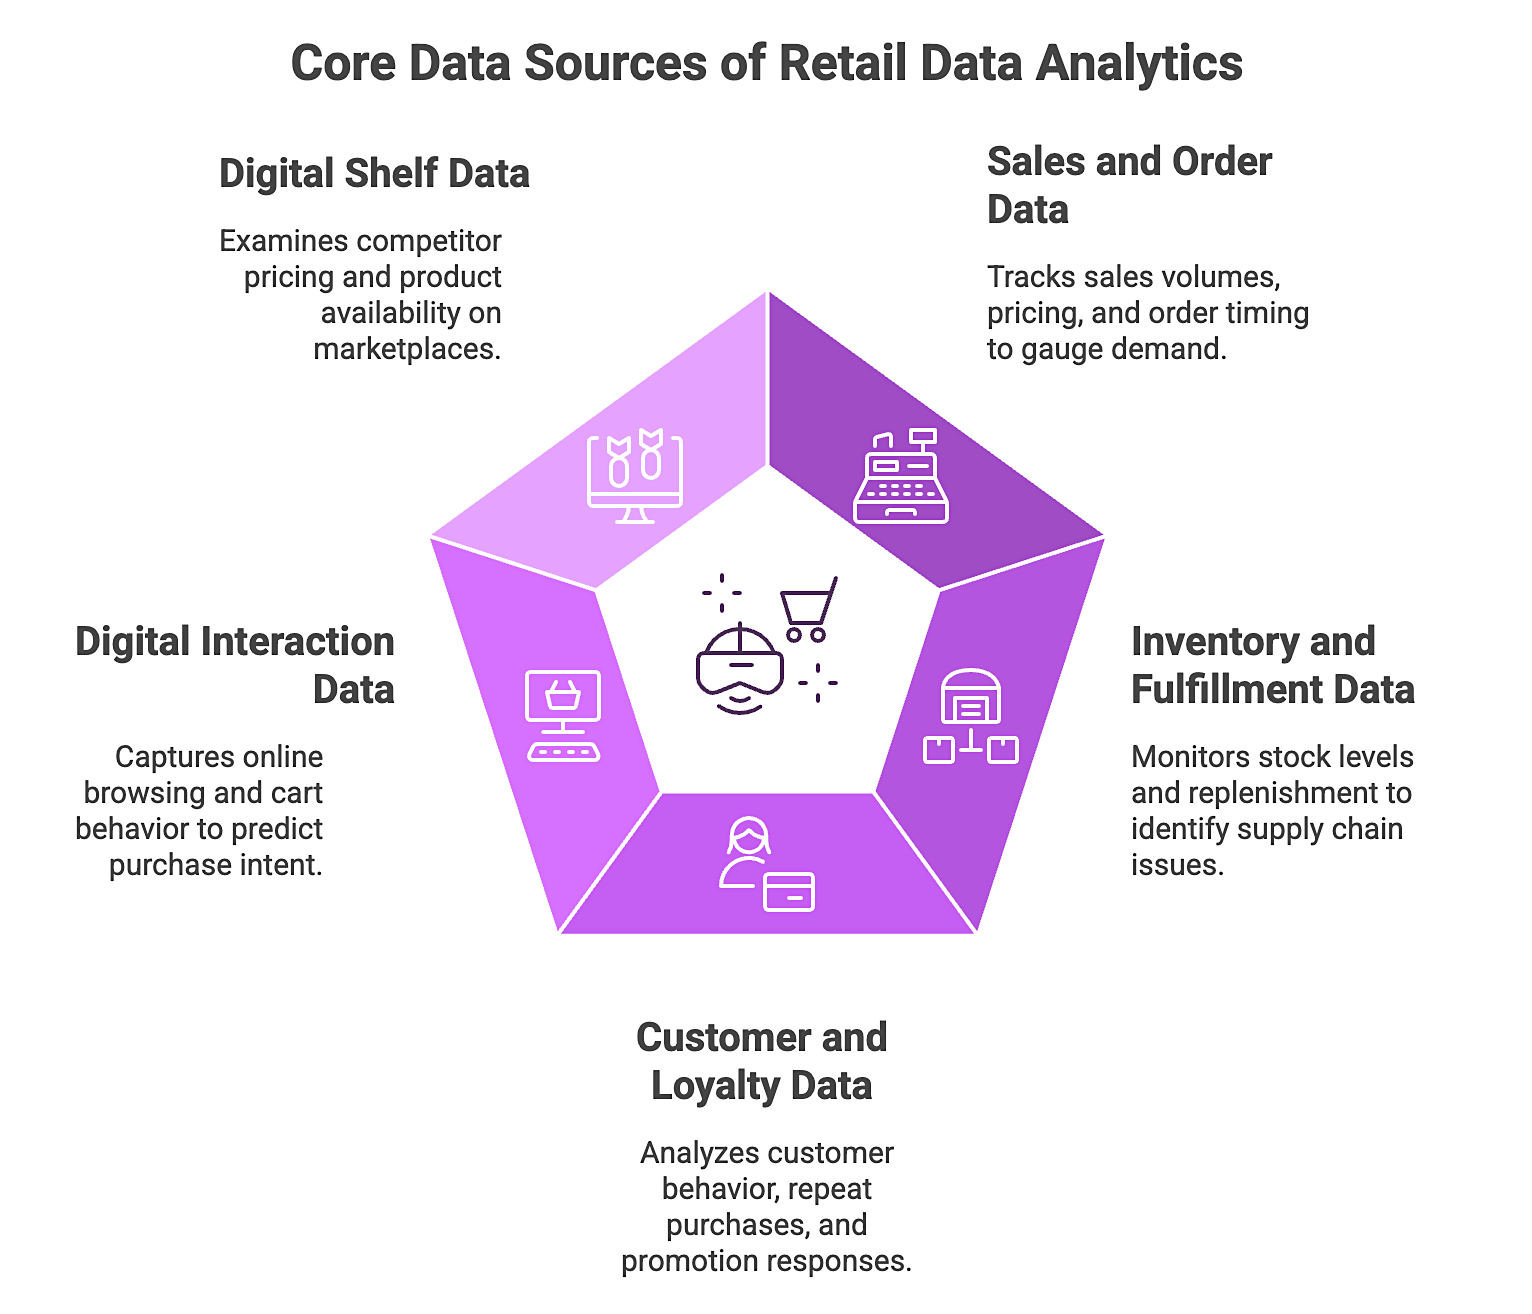
Customer and Loyalty Data
Customer and loyalty data tends to sit somewhere else entirely, often owned by a different team. Over time, this data helps explain patterns that aren’t obvious in daily sales numbers. These include repeat behavior, churn, sensitivity to price changes, or how different segments respond when promotions change or disappear.
Digital Interaction Data
Digital interaction data includes leading indicators of intent before purchase, like browsing activity, searches, product views, and cart behavior. These signals often explain changes in conversion rates that sales data has not captured yet.
Digital Shelf Data
Finally, digital shelf data captures what’s happening outside a retailer’s own systems, across marketplaces and competitor sites. This data forms the backbone of digital shelf analytics and encompasses quickly moving factors such as pricing changes, assortment gaps, availability issues, and content updates.
6 Benefits of Retail Data Analytics
Leveraging retail data analytics offers valuable benefits, including:
- More Relevant Customer Experiences – Seeing how customers behave across channels makes it easier to tailor experiences based on real behavior and context.
- Improved Demand Forecasting and Inventory Planning – Access to more timely demand signals helps teams plan inventory with greater confidence and respond proactively to changes.
- Stronger Customer Retention – Analytics helps teams recognize early shifts in customer behavior and engage more effectively over time.
- More Confident Pricing and Promotion Decisions – Clearer performance signals support pricing and promotion decisions with a better understanding of likely impact.
- True Omnichannel Visibility – Unified data provides a clearer view of performance across channels from the customer’s perspective.
- Greater Operational Efficiency – Earlier visibility into performance enables teams to focus more time on improving operations and execution.
8 Key Retail Data Analytics Tools & Technologies for 2026
A range of tools and technologies supports retail data analytics. Here’s what to keep an eye out for in 2026, ordered to follow the progression of a retail tech stack.
1. Core Retail Systems
Core retail systems still sit at the center of most analytics stacks. POS, order management, inventory, and supply chain platforms are where sales, demand, and availability first show up. These systems answer basic questions like what sold, what didn’t, and what was actually in stock at the time.
2. Customer and Loyalty Platforms
CRMs and loyalty tools hold customer-level data that helps explain patterns you don’t see in daily sales numbers alone. Over time, this data becomes essential for understanding repeat behavior, drop-off, and how different customer segments respond to changes in pricing, promotions, or availability.
3. Data Integration and Storage
Cloud data platforms pull information from retail systems, customer platforms, and external sources into a shared analytics environment. A significant amount of effort goes into resolving inconsistencies and enforcing common definitions so teams are working from the same metrics.
4. Analytics and Decision Tools
Analytics and decision tools are the most visible layer of the stack. BI dashboards, forecasting models, and AI-driven systems are used to explore performance, test scenarios, and surface recommendations that guide pricing, assortment, and operational decisions.
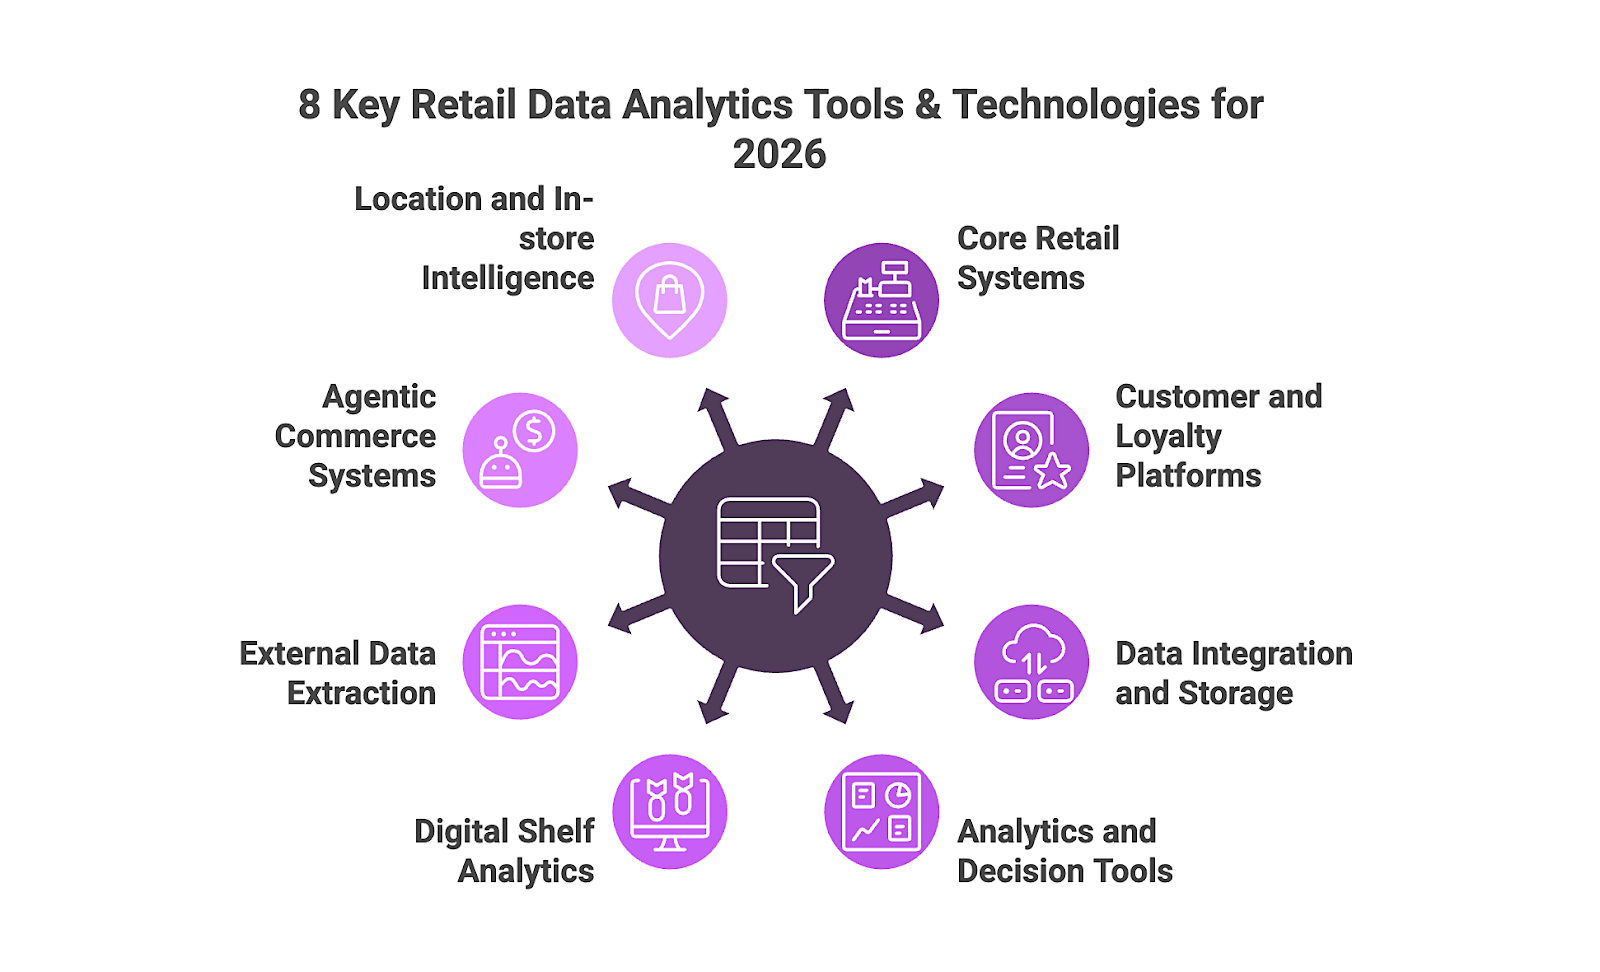
5. Digital Shelf Analytics
Digital shelf analytics tools focus on measuring pricing, availability, assortment, content, and visibility across online retailers and marketplaces. These signals reflect what shoppers actually see at the point of decision and often explain performance shifts that internal systems alone do not capture.
6. External Data Extraction Platforms
External data extraction platforms collect and structure web and marketplace data so it can be used reliably in analytics workflows. These tools turn volatile external retail environments into consistent signals that can feed warehouses, dashboards, and models. Nimble operates in this layer by delivering structured digital shelf and marketplace data at scale.
7. Agentic Commerce Systems
Agentic commerce systems are AI agents that research options and take multi-step commerce actions, such as comparing products, selecting options, and completing transactions, typically within defined constraints. These systems increasingly mediate how product discovery and purchasing happen.
Agentic commerce is a fast-emerging model where AI agents increasingly mediate product discovery and purchasing, changing how retailers win visibility and conversion. To operate effectively, these agents rely on product, price, availability, and content signals that are machine-readable and consistently correct, because those signals determine what they recommend or buy.
In agentic commerce, retailers are going beyond optimizing only for human browsing behavior to also optimize for how AI systems interpret product data when deciding what to compare, recommend, or purchase. This process is commonly referred to as Answer Engine Optimization (AEO) or Generative Engine Optimization (GEO).
In practical terms, agents evaluate products using structured signals pulled from retail surfaces, including price, availability, attributes, and seller consistency. Retail data analytics is what allows teams to see whether those signals are correct where agents evaluate them, and to identify mismatches between internal systems and what agents actually observe.
On the merchant side, agentic commerce systems also appear as goal-driven assistants that monitor conditions and propose actions, such as when to retry a payment. Nimble fits into this layer by providing structured digital shelf and marketplace data, including pricing, availability, content, and visibility, that can feed analytics and agent workflows when internal systems do not capture what is happening on external retail surfaces.
8. Location and In-store Intelligence Tools
Location and in-store intelligence tools provide insight into store traffic, trade areas, and physical shopping behavior. These signals help retailers connect digital performance with in-store execution and understand how local conditions influence demand, availability, and conversion.
8 Steps to Successfully Implement Retail Data Analytics in 2026
1. Continuously Collect Retail Data
The first step is about shifting from periodic snapshots to treating retail data as a continuous stream. Internal systems like POS, inventory, OMS, and CRM update frequently by design, and external signals need to move with that same continuity to stay useful.
When retail data updates continuously, insights stay aligned with what is actually happening in the business. Teams can see pricing shifts or promotional impact while there is still time to respond.
How to implement:
- Treat data ingestion as core infrastructure that supports reliable, continuous decision-making.
- Monitor data feeds so interruptions are detected before they surface in dashboards or reports.
- Set up alerts to catch silent data pipeline failures before they affect downstream decisions.
- Use Nimble to continuously collect public retail and marketplace data so external signals stay current alongside internal systems.
2. Extract Digital Shelf Signals at Scale
Digital shelf data captures what customers actually see online: prices, availability, assortment gaps, missing content, and changes across marketplaces and retailer sites. The goal is to capture volatile external product states at scale and convert that data into a stable stream of signals your analytics layer can actually use.
Digital shelf signals shape competitive context in real time, and extracting them at scale is what makes that context analytically meaningful. When pricing or availability shifts are captured consistently across marketplaces and retailers, analytics can reflect real market conditions early enough to inform decisions ahead of changes in internal metrics.
How to implement:
- Use a powerful web data platform to continuously collect digital shelf data in structured formats that analytics systems can consume directly.
- Capture pricing, availability, assortment, and content changes at scale across marketplaces and retailer sites.
- Design data pipelines to run continuously so digital shelf signals stay current without manual intervention.
3. Unify Data into a Single Analytics Layer
Unifying data into a single analytics layer means bringing internal and external retail data together in one place, where it provides a shared, consistent foundation for how metrics are defined and used across the business.
In practice, the analytics layer sits between raw data sources and reporting outputs, and helps reshape complex inputs into a clear, usable view of performance. With a unified analytics layer in place, teams can compare performance consistently across channels and tools.
How to implement:
- Define and document non-negotiable metric definitions centrally in your analytics layer so that all tools reference the same logic.
- Apply those definitions consistently across teams and dashboards.
- Accept that edge cases will exist initially and refine them over time.
4. Apply Automation and AI
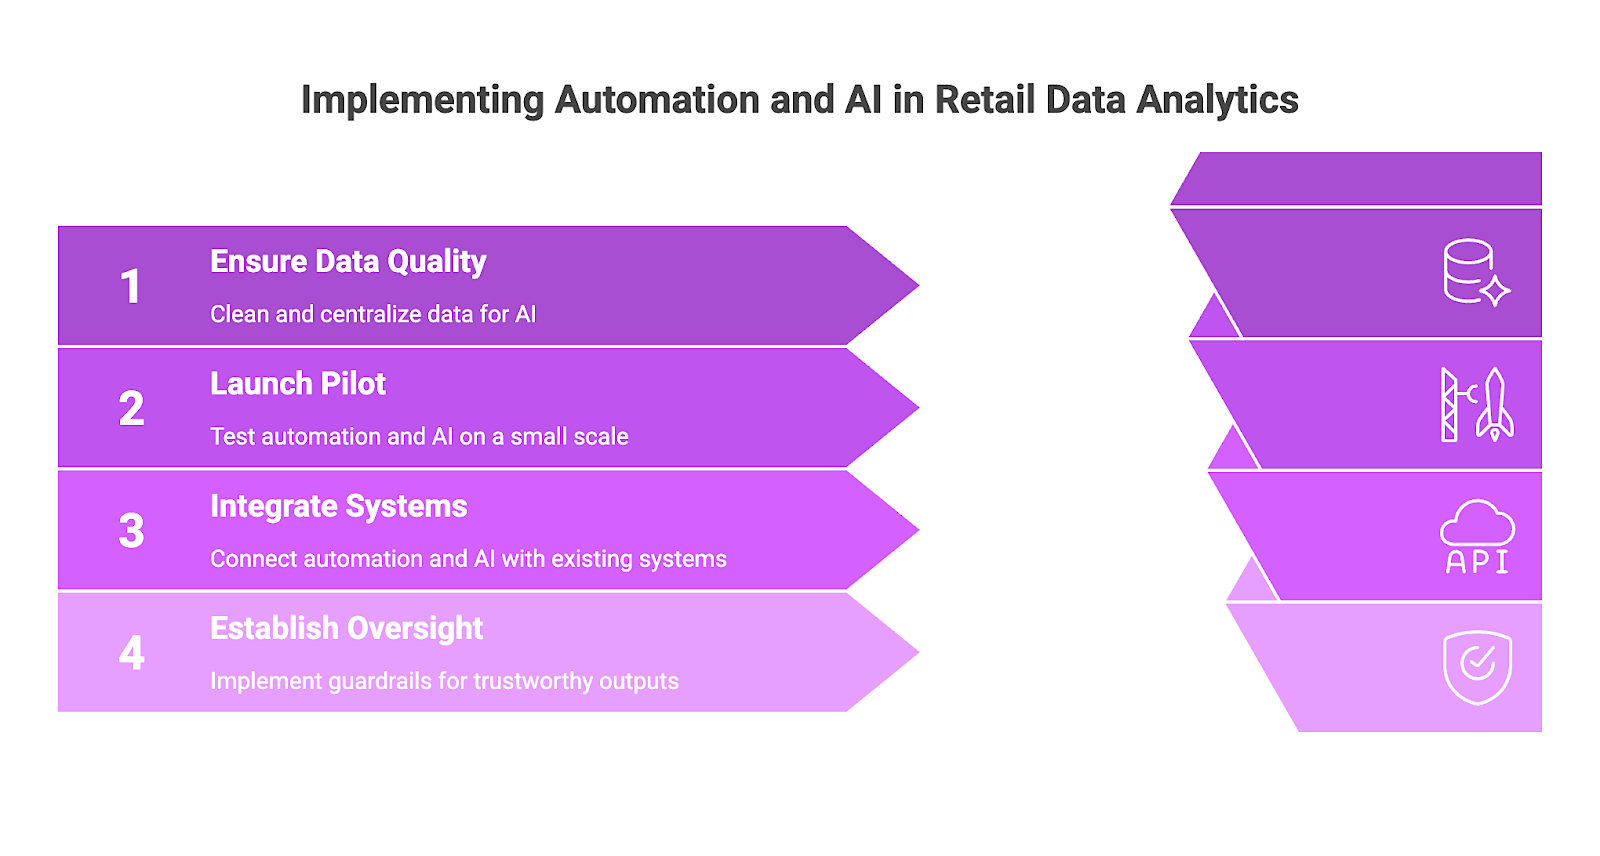
Applying automation and artificial intelligence (AI) in retail data analytics means using automation to handle high-volume, repeatable processes. AI tools are used to analyze large datasets to identify patterns that are not obvious from reporting alone. These systems can proactively perform tasks like evaluating data and updating analytical outputs as market conditions change.
Automation and AI fundamentally change what analytics can accomplish in retail. They enable personalization at scale without overwhelming operations, while improving efficiency in pricing and inventory. When conditions turn volatile, AI-driven forecasting helps protect margins by keeping supply and demand aligned. Automation also compresses reaction time so that teams can respond to emerging signals in near real-time.
How to implement:
- Define a specific objective to start with, such as responding faster to changes in availability.
- AI performance depends directly on data quality, so ensure the underlying data is clean, centralized, and governed.
- Launch a tightly scoped pilot to validate impact before expanding automation more broadly.
- Integrate automation and AI into existing systems using APIs.
- Establish clear oversight and guardrails to ensure automated outputs remain trustworthy and compliant.
5. Analyze the Full Customer Journey
Explicitly linking upstream execution data to downstream business outcomes across the customer journey is the focus of step five. Teams analyze how conditions present at the moment a customer makes a decision, such as whether a product was in stock or visible, carry forward into later behavior like repeat purchasing, returns, or margin impact.
The result is a clear view of where execution issues begin to affect long-term performance. The data can be used to decide where to change pricing, stock levels, product presentation, or fulfillment before those conditions show up in revenue or retention metrics.
How to implement:
- Build a recurring analysis that compares product availability and visibility at the time of purchase with subsequent repeat purchase rates for the same SKUs.
- Review execution changes, such as pricing updates or stock recovery, alongside downstream metrics to see which changes alter customer behavior in later periods.
- Flag SKUs or categories where downstream performance shifts before revenue changes appear, and surface those as early-warning signals.
- Use those signals to sequence execution changes, addressing the issues most likely to affect repeat demand or margin before making broader adjustments.
6. Design for Hybrid Scale and Access
Designing for hybrid scale and access means structuring retail data analytics so shared metrics can be used across teams, even when the data feeding those metrics comes from different systems and sources. The focus is on making analytics available to many users at once while maintaining a single view of performance.
Retail analytics is a shared input into pricing, merchandising, operations, and leadership decisions, so it needs to support broad access without changing from one group to another. A hybrid design makes it possible for analytics to grow across the organization while keeping performance measurement aligned.
How to implement:
- Define a single set of core metrics that all teams use, regardless of which systems or sources feed them.
- Separate metric definitions from data ingestion so changes in sources do not change how performance is measured.
- Control access at the metric level, not the raw data level, so teams see consistent outputs even as usage expands.
- Establish clear ownership for shared metrics to manage updates, validation, and downstream use as analytics scales.
7. Enable Self-service Analytics
Self-service analytics is a type of business intelligence (BI) that gives retail teams the ability to analyze performance using shared, trusted metrics that are defined and maintained by a central analytics team in a shared analytics layer. Those metrics are exposed through shared tools so teams can explore performance without redefining how it is measured.
Retail data analytics generates analytical demand across many teams at the same time. Self-service distributes analysis across pricing, merchandising, operations, and other functions, while metric ownership remains with the central analytics team. It allows teams to answer their own questions without creating parallel versions of performance.
How to implement:
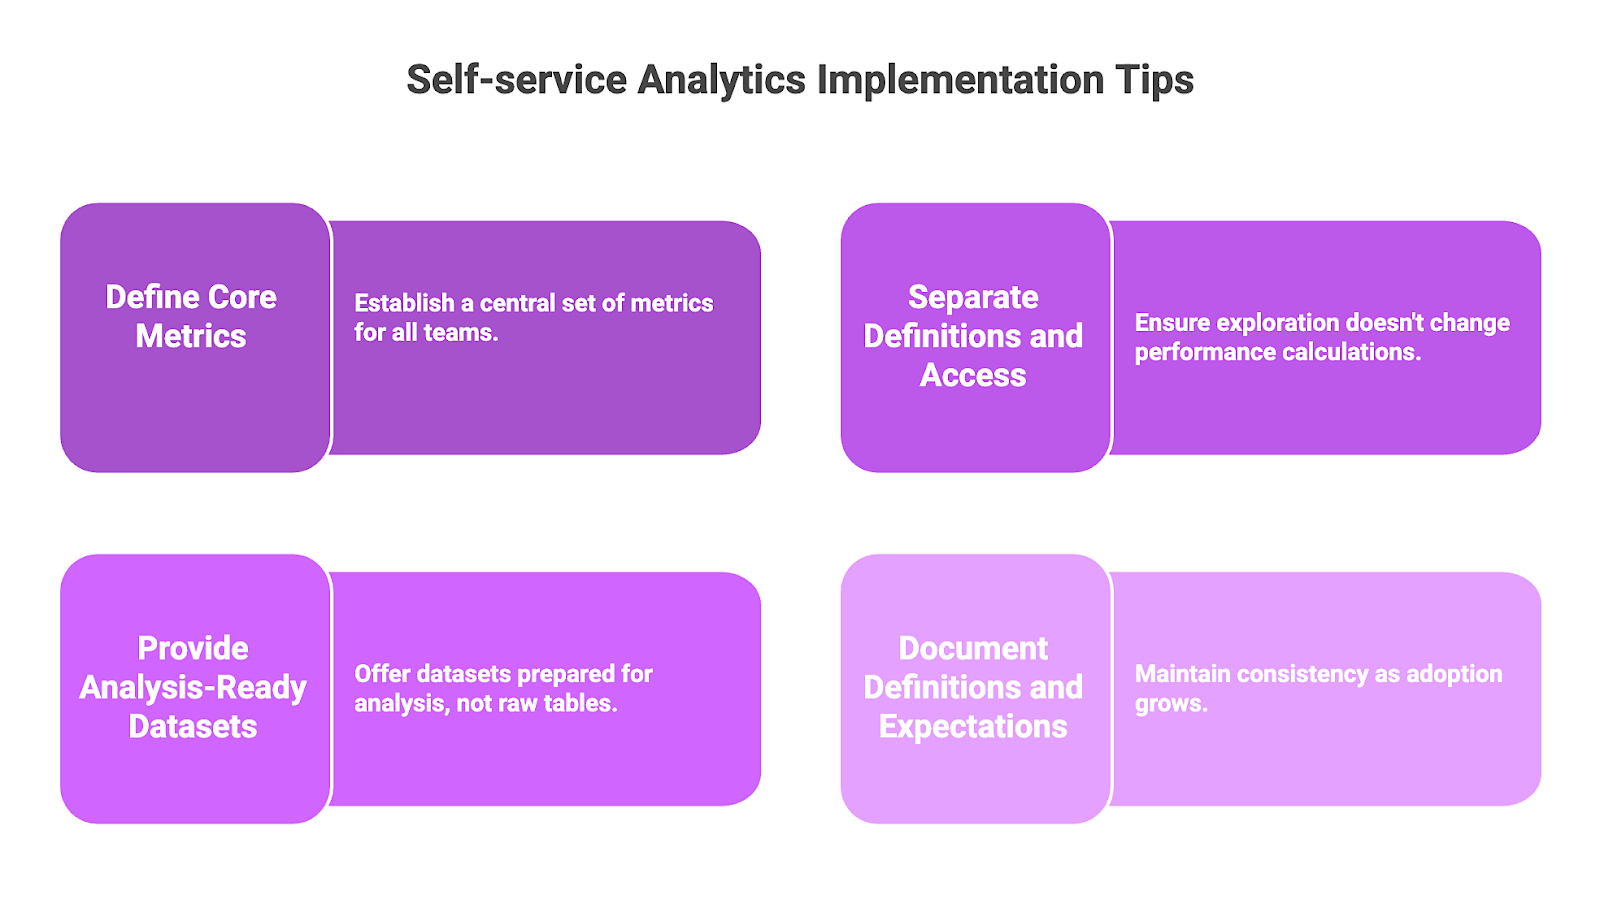
- Define a core set of centrally owned metrics that all teams use for analysis and reporting.
- Separate metric definitions from access so exploration does not alter how performance is calculated.
- Provide analysis-ready datasets rather than raw tables.
- Document metric definitions and expectations so usage stays consistent as adoption expands.
8. Measure Outcomes, Not Traffic
The final step focuses on evaluating retail performance using measures that reflect what customers actually did after reaching a point of decision. Instead of centering analysis on traffic (like visits or engagement), teams look at completed actions, such as conversion when products were available or the results of pricing changes over time. These measures reflect how retail decisions played out in market conditions.
Measuring outcomes reveals whether retail effort is translating into realized business value. Traffic-heavy analytics creates false confidence because retail teams can drive more visits, whether or not customers convert. Shifting retail data analytics away from volume-based activity metrics and toward measurements that reflect whether the business is actually working anchors analytics on the results of decisions.
How to implement:
- Use traffic metrics to quantify exposure and demand entering retail channels.
- Measure completed customer actions to observe what occurred after pricing and availability conditions were applied.
- Analyze post-decision data to understand observable changes in purchasing behavior.
- Use these observations to inform how future decisions are reviewed and adjusted.
Leverage Retail Data Analytics for Better Decision-making
In 2026, retail data analytics is how retailers turn fragmented signals into decisions that teams can act on quickly. The programs that work are based on reliable data and consistent definitions, so performance is understood the same way across channels and teams. That level of accuracy depends on real-time data, because delayed or incomplete signals undermine analytics before decisions are even made.
Nimble supports retail data analytics by extracting public digital shelf and marketplace signals at scale and in real-time, then delivering the data in formats that analytics teams can use directly in shared tools and dashboards.
Purpose-built Web Search Agents or an AI-native SDK, both powered by an autonomous browsing and data processing infrastructure, stream structured data directly into Databricks, Snowflake, S3, or your application via an API or fully managed pipeline.
Connect with Nimble today to see how real-time data improves retail data analytics and decision-making.
FAQ
Answers to frequently asked questions
.png)

%20(1).png)
.avif)
.png)

.png)
.png)