7-Step Holiday Digital Shelf Strategy to Win the 2025 Shopping Season

Nimble's Expert
.png)
7-Step Holiday Digital Shelf Strategy to Win the 2025 Shopping Season
Nimble's Expert
Most popular articles

Get structured, reliable data for your stack.
The 2025 holiday season is already moving faster than any before it. Retailers are shortening promotion windows to hours, and automated pricing systems adjust offers within minutes based on competitor data. Those changes trigger retail media algorithms to rebalance bids and rankings throughout the day. In a season this compressed, reporting delays translate directly into lost visibility, wasted spend, and shrinking margins.
During Cyber Week 2024, global online sales reached $314.9 billion, a record built on thousands of micro-adjustments in price, bid, and stock every hour. That same velocity now defines the 2025 shopping season, making it harder for brands to keep track of what is actually visible on the shelf. Most public listings show only the first ~100 results, which means products that slip deeper into pagination disappear from shopper view and from standard data collection. Visibility beyond first-page limits has become essential for accurate measurement.
With the shelf moving this fast, data that updates once or twice a day is already outdated, leaving retailers to decide on information that no longer reflects what shoppers see. To keep pace, real-time visibility has become the operational baseline, supported by continuous data pipelines that update pricing, promotion, and availability decisions as quickly as the market shifts.
This holiday season will reward brands that can see and respond to shelf changes as they happen. The ability to detect movement in pricing, visibility, and availability in real time—and act before competitors do—has become the new measure of performance. Here’s a seven-step holiday digital shelf strategy designed to win the 2025 holiday shopping season.
The Holiday Data Race: Why Legacy Workflows Can't Keep Up
How the Data Race Works
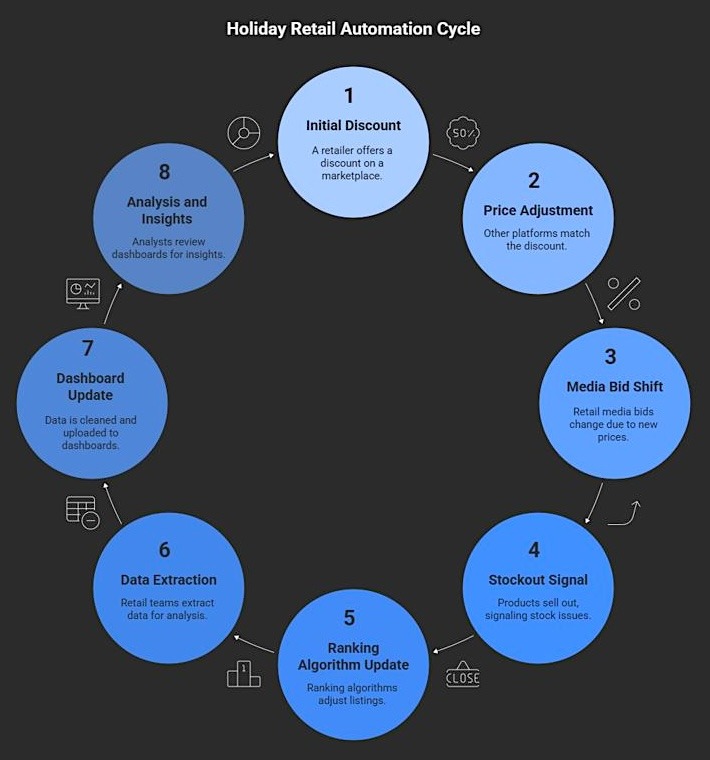
The speed of today’s retail environment comes from constant, automated reactions between pricing, advertising, and inventory systems. Every one of those changes reshapes what shoppers see on the digital shelf. As algorithms update listings and placements within minutes, the shelf itself never stands still.
Here’s an example of how it works:
- A single discount on one marketplace sets off a chain reaction as automated pricing, advertising, and inventory systems respond across channels within minutes.
- Pricing engines, advertising networks, and fulfillment databases trade updates nonstop, with each reacting to the other’s latest move.
- Within a few minutes, another platform adjusts its own price to match.
- Retail media bids shift soon after as those new prices change click-through rates and conversions.
- If a product sells out, even for a short time, ranking algorithms catch the signal from stock data and move the listing down.
The loop keeps running: adjust, react, repeat. The process moves faster than most data systems can update, and every adjustment triggers the next.
Why Legacy Workflows Fall Behind
The problem is, most retail and ecommerce teams still work on daily data cycles and only capture partial updates while the market keeps moving in real-time. They extract data once or twice a day, clean it, and upload it into dashboards the following morning. Those delays leave analysts reacting to past conditions while the market keeps moving. By the time dashboards refresh, multiple repricing loops have already played out. The result is data that looks complete but no longer reflects real shelf conditions, leading teams to act on a false picture of the market.
This constant movement now defines the holiday digital shelf. Marketplaces, ad networks, and fulfillment systems update listings and offers continuously, creating a cycle that never pauses. Ecommerce and pricing teams that still rely on once- or twice-daily data pulls from Amazon, Walmart, or Target, cleaned overnight and loaded into dashboards each morning, are already seeing a version of the shelf that no longer exists. Winning the 2025 season requires a holiday digital shelf strategy built for continuous visibility and real-time action.
7-Step Holiday Digital Shelf Strategy for 2025
Ready to win the most festive digital shelf of the year? Here’s your seven-step blueprint to succeed this holiday season:
Step 1: Establish a Reliable Baseline Before the Holiday Rush
Every strong digital shelf strategy starts with knowing what “normal” looks like. A baseline records normal conditions such as price stability, ranking patterns, stock rotation, and the competitors that dominate shared keywords.
Analysts use baselines as the control layer for everything that follows. Without it, every dip or spike looks the same. A product might fall in rank because of a price mismatch, or simply because a competitor boosted ad spend for a few hours. This is a common challenge during new product introductions.
The difference only becomes visible against a measured, pre-season benchmark. It becomes the reference point for every real-time signal that follows, showing exactly when shelf conditions start to shift.
How to do it:
- Collect daily pre-season data for several weeks before the holiday period on price, rank, and stock for key SKUs across marketplaces. Digital shelf analytics tell a story only if the starting point is clean and complete.
- Use a consistent schema with SKU, channel, price, inventory, rank, and timestamp fields. Ensure time-zone consistency across data sources.
- Include competitor products for comparison.
- Define benchmark ranges for normal variation.
- Confirm complete SKU and channel coverage, including regional variants and marketplace storefronts, before tracking.
Step 2: Track Pricing and Promotions Continuously Across Channels
Marketplaces adjust automatically when conversion rates dip or when stock gets low. Retail media networks follow along, tweaking bids to keep ads in front of active buyers. It’s a feedback loop that never stops once the season begins.
Teams that operate without real-time pricing data never see most of what happens. Continuous tracking is the only way to keep your digital shelf strategy up to date, much like maintaining clear workflows that prevent bottlenecks across teams. A slight delay in awareness can cost more than the discount itself.
With live shelf data, pricing analysts and merchandisers can see the movement and decide whether to hold, match, or wait. Timestamped data shows when the market moves and how fast it reacts.
How to do it:
- Stream live pricing and promotion data across all channels using automated tools.
- Timestamp every update to track event sequences.
- Log discounts, bundles, and coupon activity.
- Monitor recurring competitor patterns.
- Analyze trends to predict adjustments and plan timely counteractions.
Step 3: Monitor Real-Time Search Visibility During Peak Events
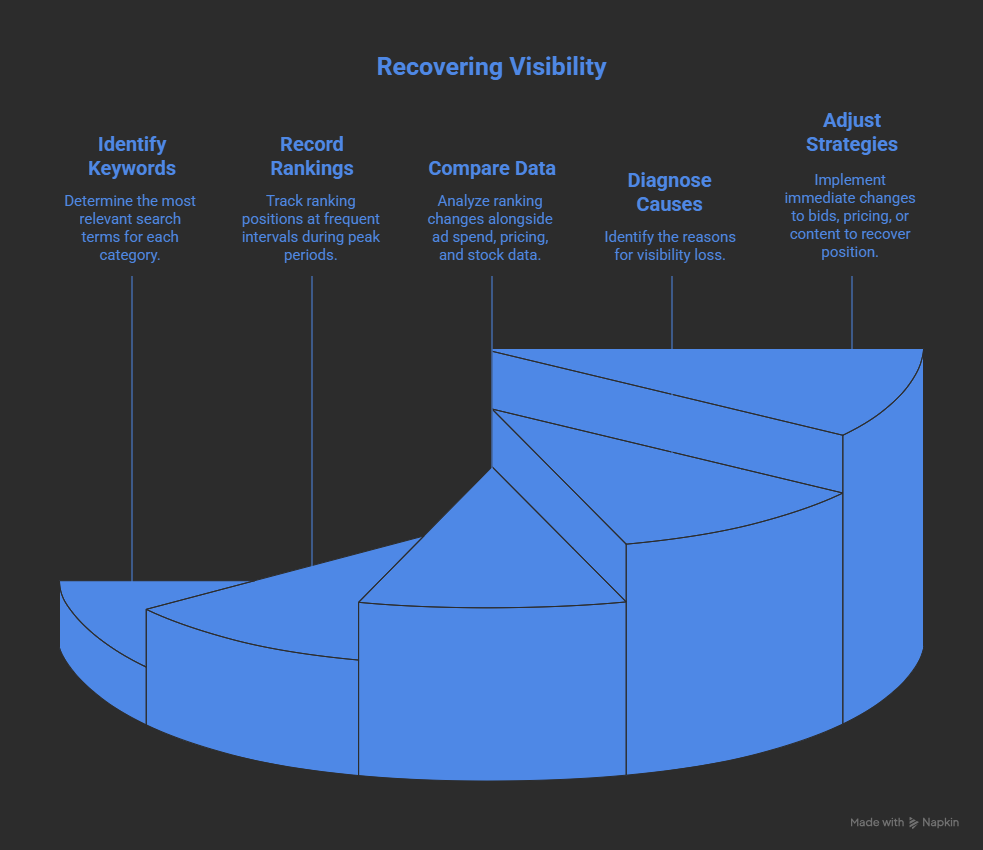
Search visibility determines whether shoppers see a product during major shopping events such as Black Friday, Cyber Monday, and the final shipping week before Christmas. Every ranking jump has a reason. Sometimes, it’s a higher ad bid, sometimes a price cut, or sometimes, the stock counter dips below what the algorithm trusts. Tracking search position in near real time keeps discoverability stable while competitors fluctuate.
Even short drops in SERP ranking can erase hours of sales momentum and break your digital shelf strategy. A single move from page one to page two can reduce traffic by more than half, especially during high-intent windows when conversion rates spike. Continuous visibility monitoring allows teams to spot downward movement and correct the cause before volume declines.
How to do it:
- Identify top search keywords by category across marketplaces.
- Record SERP ranking positions at frequent intervals during peak periods.
- Compare ranking changes with ad spend, pricing, and stock data.
- Diagnose the causes of SERP visibility loss.
- Adjust bids, pricing, or content immediately to recover position.
Step 4: Connect Pricing, Visibility, and Conversion Signals
Integrating pricing data, ranking position, and sales performance into one view exposes the fundamental drivers behind market movement. Price, visibility, and conversion metrics influence performance in ways that often go unseen when data sits in separate dashboards.
When the three signals remain disconnected, analysis and your digital shelf strategy become reactive. A sales drop may come from weak demand when the root cause lies in a mid-day price increase or a short-term loss of visibility. Unified datasets reveal how adjustments in one variable affect the others, allowing teams to correct course with evidence rather than speculation.
How to do it:
- Merge pricing, ranking, and conversion data into one continuously updated dataset.
- Align timestamps to reveal genuine cause-and-effect relationships.
- Analyze how rank shifts affect conversions at different price points.
- Identify pricing sensitivity thresholds.
- Apply insights to refine promotions, ads, and pricing as updates occur.
Step 5: Detect Stockouts & Fulfillment Risks Before They Impact Rank
Marketplace ranking systems such as Amazon’s A10, Walmart Marketplace’s Search & Discovery, Target Plus, and eBay’s Best Match evaluate more than simple inventory status. Each system measures fulfillment reliability by reading seller APIs, warehouse feeds, and carrier tracking data signals.
Metrics like on-time shipment rate, remaining stock, and delivery window accuracy feed into a reliability score that shapes visibility. When that score dips, listings start to vanish. It happened on Amazon Prime Day 2025, when sudden sell-outs and fake discounts made the data unreliable long before anyone caught on.
How to do it:
- Track stock levels and replenishment rates for every SKU in real time.
- Set alerts for low inventory on top-performing products.
- Measure delivery accuracy against marketplace estimates.
- Prioritize fulfillment for high-demand listings.
- Record corrective actions to improve future forecasting.
Step 6. Feed Real-Time, Structured Shelf Data Into Pricing, Ad, and Forecast Systems
Structured, real-time shelf data for your digital shelf strategy is only useful when it connects directly to the systems that act on it. A feed that updates every few minutes can push new pricing data into Salesforce Commerce Cloud, Shopify Plus, or a custom Google Cloud BigQuery model that runs automated price tests.
Forecasting teams can pull the same structured data into Snowflake or Databricks to refine demand models daily instead of weekly. Advertising data can stream through Amazon Advertising, Google Ads, or Criteo Retail Media, where live inputs trigger bid adjustments without manual oversight. Analysts normalize each stream with fields for SKU, channel, price, inventory level, and rank position.
When competitors drop prices or rankings change, the connected systems immediately update promotions, reroute stock, and rebalance budgets.
How to do it:
- Define schema fields, including timestamp, SKU, channel, metric type, and confidence score.
- Validate datasets’ accuracy and completeness before ingestion.
- Stream structured data via APIs or message queues to internal systems.
- Match refresh rates to decision speed.
- Measure downstream performance improvements.
Step 7: Scale Every Step With Nimble’s Web Search Agents
Nimble provides the automation and infrastructure that make the first six steps continuous, accurate, and scalable across channels and regions. Here’s how:
Nimble’s Web Search Agents form the infrastructure that automates digital shelf intelligence. Agents collect what a human analyst would check manually: SKU prices, Buy Box holder, delivery speed, promo labels, and review trends across Amazon, Walmart, and Target. They also scan Google Shopping and brand pages to see how ads and product content move together.
Legacy scrapers break as soon as a page layout shifts or a site adds a new layer of JavaScript. Nimble’s agents don’t. They rebuild routes on the fly, switch proxies when requests fail, and check every captured field against a validation rule before delivery to the client dataset. The result is data that stays usable even when sites change daily.
How Nimble enables six winning digital shelf strategies:
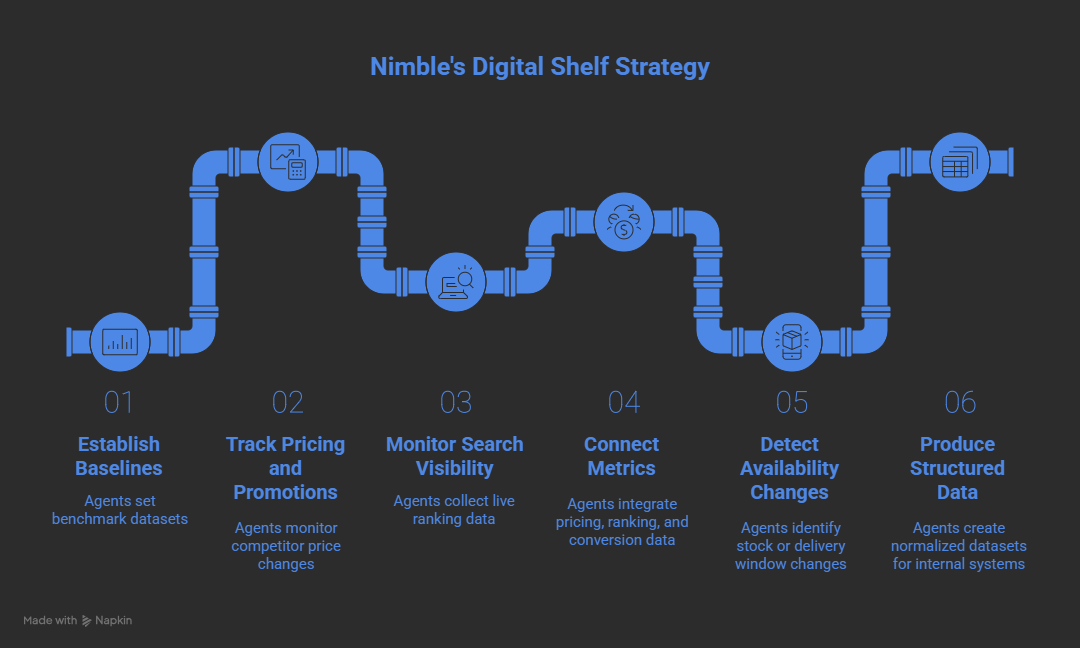
- Baselines (Step 1): Agents establish and refresh benchmark datasets automatically before and during the holiday season.
- Pricing and Promotions (Step 2): Agents track competitor price and promotion changes at the same frequency as automated repricing systems.
- Search Visibility (Step 3): Agents collect live ranking and placement data from marketplaces and search surfaces to capture movement as it occurs.
- Connected Metrics (Step 4): Agents pull pricing, ranking, and conversion data into the same feed so teams can see which changes move sales. A small price drop might lift rank but hurt margin; seeing the signals together makes that visible.
- Availability (Step 5): Agents immediately identify stock or delivery window changes, allowing fulfillment teams to act before visibility declines.
- Structured Data (Step 6): Agents produce time-stamped, normalized datasets ready for ingestion by internal models and reporting systems.
Get Winning Digital Shelf Insights for the Holiday Shopping Season
The retailers who win the 2025 shopping season are the ones who stay connected to the digital shelf as it changes and make decisions while opportunities are still on the holiday table. Winning requires reliable, automated ways of capturing digital shelf data and turning it into usable insight as fast as it changes.
That reliability comes from Nimble’s Web Search Agents. They capture live signals across marketplaces and retail media, covering everything from price updates to promotions and reviews, and turn those inputs into clean, analysis-ready datasets. The result is a clear, current view of the digital shelf that updates as fast as the market itself.
Book a Nimble demo to discover how it delivers real-time digital shelf insights that will help your brand win the holidays.
FAQ
Answers to frequently asked questions


.png)

.png)
.avif)